Assessing chemical diversity is an integral part of library design. Depending on the specific requirements (e.g., lead discovery, target-focused), numerous approaches are available for assessing diversity. A common approach, however, is to calculate a (possibly large) number of relevant properties and/or descriptors for each compound in the library and use
principal component analysis (PCA) to project the data as either 2- or 3-dimensional diversity plot. This approach affords an effective way of visually assessing property and/or activity diversity of chemical libraries, but it's not clear how structural diversity can similarly be achieved. Here, part of the difficulty is due to the lack of an effective method for encoding of structural features as Euclidean vectors (which are necessary for linear dimensionality reduction methods such as PCA to work properly). Instead, structural features are most effective when encoded as either fixed-length binary vectors or hologram fingerprints (i.e., sparse vectors consisting of structural feature counts) with appropriate proximity metrics defined.
An obvious alternative to PCA is
multidimensional scaling (MDS). MDS is a non-linear dimensionality reduction technique that can be effective at revealing the "natural" manifold of the underlying dataset. An interesting aspect of data embedding with MDS is that only pairwise proximity (e.g., distances) values are required (and moreover, the proximity metric used doesn't have to strictly adhere to the standard definition of
metric space). This is quite convenient in that now we don't have to construct an explicitly encoding of the molecular graph for embedding. For example, a reasonable proximity metric can be defined in terms of maximum common subgraph (MCS), whereby the molecular graphs are used directly in the calculation of the metric values (though doing so is only practical for small datasets because of the combinatorial nature of existing MCS algorithms).
A drawback of classical MDS algorithm is that the number of computed proximity values (and hence the memory requirement) is quadratic with the size of the library. This is not practical for all but small libraries. There exist a number of scalable MDS algorithms in the literature. Here we have implemented one such algorithm known as
FastMap. This algorithm can scale to libraries of hundreds of thousands of compounds, though the implementation below is limited by the physical memory allotted by Java webstart. (Please let us know if you would like to run FastMap on large libraries.)
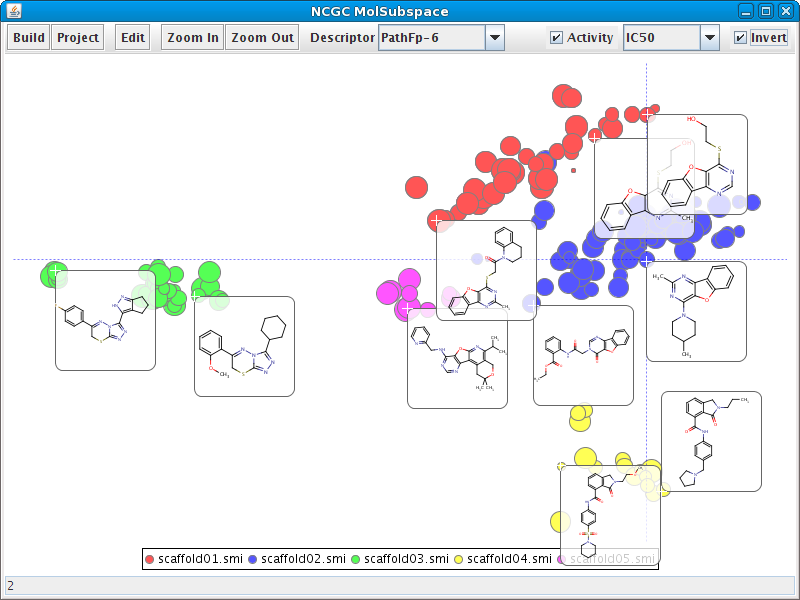
A Java webstart tool to experiment with FastMap is available
here. Below is an example of FastMap embedding of a
CRE dataset (partitioned by the different active scaffolds).